Construction Visualization
The idfkit.visualization module provides SVG diagram generation for
construction assemblies, showing layer sequence, thicknesses, and thermal
properties.
Python only, permanently
Rendering a model to a vector image belongs to Python alone. JavaScript is not waiting on a port and will not gain a counterpart: this is a permanent boundary, so no issue tracks it, and moving the capability out of that state takes a constitutional amendment rather than a ledger edit.
A Python-side capability with no JavaScript counterpart and no plan for one. The output
is a static vector image produced for a notebook, a report, or a file on disk, which is
a Python workflow. A JavaScript caller wanting to look at a model is already in a
runtime that draws, and is served by the other mechanism: see
scene-rendering. Recording the two as one
visualization entry would make each language read as missing something the other has,
which is exactly the failure FR-078 and FR-068 forbid.
The full entry, including the vocabulary this capability owns, is on the capability parity page.
Quick Start
In Jupyter/IPython
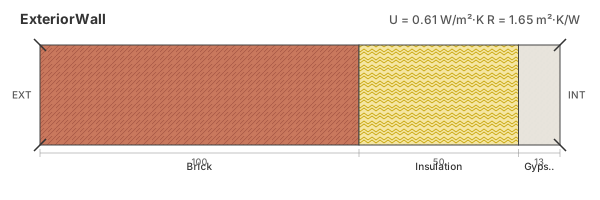
Construction objects display automatically as SVG diagrams in Jupyter notebooks:
from idfkit import load_idf

model = load_idf("building.idf")
wall = model["Construction"]["ExteriorWall"]

# Just display the construction - SVG renders automatically
wall
Manual SVG Generation
from idfkit.visualization import construction_to_svg

svg = construction_to_svg(wall)

# Save to file
with open("wall_section.svg", "w") as f:
    f.write(svg)
Diagram Features
The SVG diagram includes:
- Layer rectangles proportional to thickness
- Material names below each layer
- Thickness labels for each layer
- Thermal properties (U-value, R-value, SHGC)
- Outside/Inside indicators
- Color coding by material type
Opaque Constructions
For walls, roofs, and floors:
┌─────────────────────────────────────────────────────────┐
│  ExteriorWall                    U = 0.54 W/m²·K       │
│                                  R = 1.87 m²·K/W       │
├─────────────────────────────────────────────────────────┤
│ OUT                                               IN   │
│  ┌────┬────┬──────────────┬────────────┬──┐           │
│  │████│    │░░░░░░░░░░░░░░│████████████│  │           │
│  │████│air │░░░░░░░░░░░░░░│████████████│  │           │
│  │████│gap │░░insulation░░│██concrete██│pl│           │
│  │████│    │░░░░░░░░░░░░░░│████████████│  │           │
│  └────┴────┴──────────────┴────────────┴──┘           │
│  brick  R=0.15  R=1.25        R=0.12    R=0.06        │
│  0.1m          0.05m          0.2m      0.01m         │
└─────────────────────────────────────────────────────────┘
Window Constructions
For glazing systems, SHGC is also displayed:
┌─────────────────────────────────────────────────────────┐
│  TripleGlazing                   U = 0.78 W/m²·K       │
│                                  SHGC = 0.47           │
├─────────────────────────────────────────────────────────┤
│ OUT                                               IN   │
│  ┌──┬─────────┬──┬─────────┬──┐                       │
│  │▒▒│  Argon  │▒▒│  Argon  │▒▒│                       │
│  │▒▒│         │▒▒│         │▒▒│                       │
│  │▒▒│   12mm  │▒▒│   12mm  │▒▒│   ← Low-E indicator  │
│  │▒▒│         │▒▒│         │▒▒│                       │
│  └──┴─────────┴──┴─────────┴──┘                       │
│  6mm           6mm          6mm                        │
└─────────────────────────────────────────────────────────┘
Low-E coatings (emissivity < 0.2) are indicated with an orange line on the coated surface.
Color Coding
Materials are color-coded based on type and name:
Opaque Materials
| Material Type | Color |
|---|---|
| Concrete | Gray (#808080) |
| Brick/Masonry | Firebrick (#B22222) |
| Insulation | Gold (#FFD700) |
| Wood | Burlywood (#DEB887) |
| Gypsum/Drywall | Beige (#F5F5DC) |
| Plaster/Stucco | Floral White (#FFFAF0) |
| Metal | Silver (#C0C0C0) |
| Other | Sienna (#A0522D) |
Special Layer Types
| Layer Type | Visual |
|---|---|
Material:NoMass |
Lavender with dot pattern |
Material:AirGap |
Light blue with diagonal lines |
WindowMaterial:Glazing |
Sky blue with vertical lines |
WindowMaterial:Gas |
Alice blue (very light) |
Customization
Use SVGConfig to customize the diagram appearance:
from idfkit.thermal import get_thermal_properties
from idfkit.visualization import SVGConfig, generate_construction_svg

props = get_thermal_properties(wall)

config = SVGConfig(
    width=800,           # SVG width in pixels
    height=300,          # SVG height in pixels
    padding=30,          # Padding around diagram
    min_layer_width=40,  # Minimum width for thin layers
    font_size=14,        # Base font size
)

svg = generate_construction_svg(props, config)
SVGConfig Options
Configuration for SVG construction diagrams.
Attributes:
| Name | Type | Description |
|---|---|---|
width |
int
|
Total SVG width in pixels |
height |
int
|
Total SVG height in pixels |
padding |
int
|
Padding around the diagram |
header_height |
int
|
Height of the header section |
footer_height |
int
|
Height of the footer/labels section |
min_layer_width |
int
|
Minimum width for thin layers |
font_family |
str
|
Font family for text |
font_size |
int
|
Base font size in pixels |
font_size_small |
int
|
Small font size for labels |
font_family = 'system-ui, -apple-system, sans-serif'
class-attribute
instance-attribute

font_size = 12
class-attribute
instance-attribute

font_size_small = 10
class-attribute
instance-attribute

footer_height = 50
class-attribute
instance-attribute

header_height = 40
class-attribute
instance-attribute

height = 200
class-attribute
instance-attribute

min_layer_width = 30
class-attribute
instance-attribute

padding = 20
class-attribute
instance-attribute

theme = 'auto'
class-attribute
instance-attribute

width = 600
class-attribute
instance-attribute

Theming
SVG diagrams support light and dark color themes via CSS custom properties.
Dark Mode
from idfkit.visualization import SVGConfig, construction_to_svg

svg = construction_to_svg(wall, config=SVGConfig(theme="dark"))
Auto (OS Preference)
The "auto" theme uses @media (prefers-color-scheme: dark) to automatically
match the user's OS or browser setting:
When embedded in HTML or displayed in Jupyter, the SVG will switch between light and dark palettes based on the host environment's color scheme.
Embedding in HTML
The generated SVG can be embedded directly in HTML:
from idfkit.visualization import construction_to_svg

svg = construction_to_svg(wall)

html = f"""
<!DOCTYPE html>
<html>
<head><title>Wall Construction</title></head>
<body>
    <h1>Exterior Wall Assembly</h1>
    {svg}
</body>
</html>
"""

with open("wall.html", "w") as f:
    f.write(html)
API Reference
Functions
construction_to_svg(construction, config=None)
Generate SVG for a Construction IDFObject.
Parameters:
- construction: Construction IDFObject (must have obj_type == "Construction")
- config: Optional SVGConfig for customization (including theme)
Returns: SVG string
Raises:
- TypeError: If not an IDFObject or not a Construction
generate_construction_svg(props, config=None)
Generate SVG from thermal properties.
Parameters:
- props: ConstructionThermalProperties from get_thermal_properties()
- config: Optional SVGConfig for customization
Returns: SVG string
Classes
SVGConfig
Configuration dataclass for SVG diagram customization.
See SVGConfig Options for available settings.
IPython/Jupyter Integration
Construction objects implement _repr_svg_() for automatic rich display:
# In Jupyter, this displays as SVG:
wall

# Check if SVG is available:
svg = wall._repr_svg_()
if svg:
    print("SVG available")
else:
    print("SVG not available (not a Construction or no document)")
The _repr_svg_() method returns:
- SVG string for Construction objects with a parent document
- None for non-Construction objects or objects without a document reference
3D Model Visualization
The idfkit.visualization module also provides interactive 3D building
model viewers using plotly. These are useful for model QA and geometry
exploration in Jupyter notebooks.
Requires the
plotlyextra:pip install idfkit[plotly]
Quick Start
from idfkit import load_idf
from idfkit.visualization import view_model

model = load_idf("building.idf")
fig = view_model(model)
fig.show()
Available Views
view_model(doc, *, config, title, zones)
Interactive 3D building viewer with orbit, pan, and zoom controls.
from idfkit.visualization import view_model, ModelViewConfig, ColorBy

fig = view_model(model, config=ModelViewConfig(color_by=ColorBy.SURFACE_TYPE))
view_floor_plan(doc, *, config, title, z_cut, zones)
2D top-down floor plan projection. Shows floor polygons; optionally slices walls at a given Z height.
view_exploded(doc, *, config, title, separation, zones)
Pulls zones apart to reveal internal partitions and inter-zone surfaces.
view_normals(doc, *, config, title, arrow_length, zones)
Displays surface normal arrows for orientation QA. Useful for checking that surfaces face the correct direction.
Configuration
Use ModelViewConfig to customize the 3D view appearance:
from idfkit.visualization import ModelViewConfig, ColorBy

config = ModelViewConfig(
    width=1200,
    height=800,
    color_by=ColorBy.BOUNDARY_CONDITION,
    show_fenestration=True,
    show_edges=True,
    show_labels=True,
    opacity=0.9,
)
ModelViewConfig Options
Configuration for 3D model visualization.
Attributes:
| Name | Type | Description |
|---|---|---|
width |
int
|
Figure width in pixels. |
height |
int
|
Figure height in pixels. |
color_by |
ColorBy
|
Strategy for coloring surfaces. |
show_fenestration |
bool
|
Whether to display windows/doors. |
show_edges |
bool
|
Whether to display wireframe edges. |
show_labels |
bool
|
Whether to display zone labels. |
opacity |
float
|
Surface opacity (0-1). |
fenestration_opacity |
float
|
Window/door opacity (0-1). |
background_color |
str
|
Plot background color. |
edge_color |
str
|
Wireframe edge color. |
edge_width |
float
|
Wireframe edge width. |
background_color = '#f8f9fa'
class-attribute
instance-attribute

color_by = ColorBy.ZONE
class-attribute
instance-attribute

edge_color = 'rgba(40, 40, 40, 0.6)'
class-attribute
instance-attribute

edge_width = 1.5
class-attribute
instance-attribute

fenestration_opacity = 0.4
class-attribute
instance-attribute

height = 700
class-attribute
instance-attribute

opacity = 0.85
class-attribute
instance-attribute

show_edges = True
class-attribute
instance-attribute

show_fenestration = True
class-attribute
instance-attribute

show_labels = True
class-attribute
instance-attribute

width = 1000
class-attribute
instance-attribute

ColorBy Options
| Value | Description |
|---|---|
ColorBy.ZONE |
Color surfaces by thermal zone |
ColorBy.SURFACE_TYPE |
Wall / Floor / Roof / Ceiling |
ColorBy.BOUNDARY_CONDITION |
Outdoors / Ground / Surface / Adiabatic |
ColorBy.CONSTRUCTION |
By construction name |
Filtering by Zone
All view functions accept a zones parameter to display only specific zones:
See Also
- Thermal Properties — R-value, U-value, SHGC calculations
- Objects — IDFObject reference